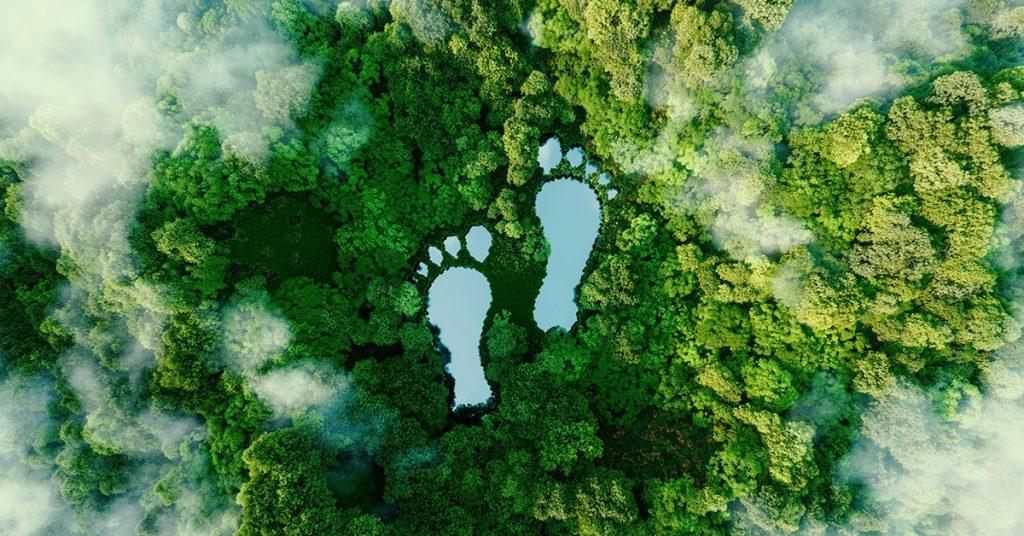
We often hear both terms in the title and often use them as synonyms for each other. But what is the difference between the two? Simply put: every carbon footprint is an ecological footprint, but not every ecological footprint is a carbon footprint.
Part of the bigger picture: the carbon footprint
When we talk about our carbon footprint, we mean the amount of greenhouse gases we produce by the way we live – the higher the number, the greater our contribution to climate change. But we can calculate it for more than just ourselves: we can also measure the carbon footprint of our food, our workplace… or even the phone or computer you’re reading this on.
Carbon footprints are calculated using the carbon dioxide equivalent, i.e. any greenhouse gas is ‘converted’ to CO2.
To find out how much of these gases we produce, we need to consider not just the direct emissions, but also what we produce indirectly, often without even thinking about it: baking, cooking, eating, drinking, heating, cooling, lighting, charging batteries – and all just in our homes. But we also go out by car, bus or plane to work, go on holiday or go shopping.
How much land is needed to absorb the gases produced is, well, our carbon footprint’s contribution to our total ecological footprint…
The ecological footprint
In addition to our use of fossil fuels, we also have an impact on the environment in other ways. The ecological footprint shows how many hectares of land it takes to sustain us.
In addition to our carbon footprint, five other footprints contribute to this:
- pasture footprint:
ever wondered how much land we need to feed our animals? this index will show it to you.
- cropland footprint:
we can also calculate how many hectares of arable land we need to produce enough food for ourselves and our (carnivorous) animals to eat, but it also includes the land needed for the crops we use to make clothes or biofuels, for example.
- forest footprint:
this shows how much land we use to make furniture, firewood or paper,
- fisheries footprint:
this shows how much of our rivers, lakes, seas and oceans we use to fish, catch – and replenish – shrimp and other living things,
- settlement footprint:
the built-up areas are where we live – our houses, the infrastructure we use, offices, factories or even schools, shopping centres, theatres and cinemas.
According to the Global Footprint Network, we Europeans needed about 4.7 hectares per person in 2016, while the country’s biocapacity is only 2.1 hectares per person. This means that in 2016, we all had to use 2.5 ha from other parts of the world.
Want to know how to reduce it? Check out our next post.


